


ScriptKiddiez | 1D, 2D, 3D– Go!
The Challenge | 1D, 2D, 3D– Go!
HOPE
HOPE is a 3D simulation of satellite trajectory of GRACE-FO, 3D visualization of satellite GRACE, AQUA and TERRA's orbit and functionalities also with VR, current scenario of CO2 emission, sea level visualization in 3D along with future scenario.
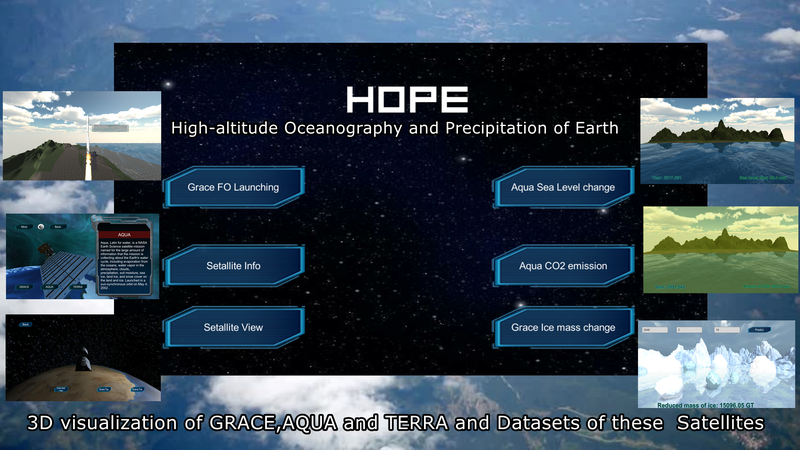
High-altitude Oceanography and Precipitation of Earth (HOPE) is a simulation of current satellite systems - GRACE, TERRA and AQUA. We used datasets provided by open nasa to simulate and visualize 3D view of trajectory, orbit, current and future scenario of earth. We used machine learning to predict future scenario of data and visualize the predicted data. We have simulated the launching of GRACE-FO(Gravity Recovery and Climate Experiment Follow-On). We visualized some satellite in 3D e.g. GRACE, TERRA and AQUA. User can switch in different point of view to watch the position of these satellites in nearly real time. Our visualization shows current sea level rise, CO2 emission, Greenland ice mass change, Antarctica ice mass change, Ocean ice mass change. We also predicted future scenario by using those data applying machine learning. We have options of watching earth virtually from TERRA, GRACE and AQUA using VR device.
Our list of modules:
- Introduction of Satellites and their functionalities.
- GRACE-FO Mission Simulation.
- 3D View of Satellites Orbiting Earth from different camera angle.
- VR visualization with Google cardboard.
- Carbon-di-oxide emission and prediction.
- Sea level rise visualization and prediction.
- Ice mass data visualization and prediction.
- Sea surface temperature rise visualization.
We are showing AQUA, GRACE-FO and TERRA satellites in 3D view and their different parts and functionalities. we also providing verbal description of these satellites. We used 3D models of these satellite from nasa3d.open.nasa.gov. Educators, students and knowledge seekers will be benefited by knowing these satellites. Nasa can add more satellites this way to let people know about satellites and their functionalities easily.
We are also simulating the launching of GRACE-FO from Vanderberg Air Force Base, California, USA which will take off in early 2018 using the first ever reused falcon-9 Dragon rocket of SpaceX. We used real trajectory data achieved from jpl.nasa.gov to simulate the launching. This module is also VR enable. So, user would be able to get real sensation of watching mission launching using Google cardboard VR.
All these three satellites orbiting the earth are shown in 3D. Their trajectories are designed such a way that they cover the whole earth in a period of time. We are simulating GRACE-Tellus, AQUA and TERRA around the earth with different camera views in 3D completely with our own paradigm and code. Here we are also considering the gravitational fact of two GRACE satellites that are maintaining a maximum and minimum distance between them(podaac.jpl.nasa.gov). Users also can experience the view of earth as he is in a specific satellite using VR.
Now-a-days, use of VR is becoming very common to represent various projection fact. So, in HOPE we have options to experience real sensation of 3D views using Google cardboard VR.
Carbon-di-oxide emission rate has become the major headache of environment scientists and so far in most research area. We are visualizing the growth of carbon-di-oxide emission in earth surface. In this case, we have used AQUA data from AIRS(climate.nasa.gov). We also implemented a simple machine learning technique(Single value linear regression) to predict near future carbon-di-oxide data for visualization. It could be a fantastic feature to make awareness about global warming in mass people.
Another alarming affect of climate change is the sea level rising. In HOPE, we have an option to visualize the rising sea level over time. We used AQUA, JASON-1 and JASON-2 satellites data for that(climate.nasa.gov). Hence we also use simple machine learning (linear regression) to visualize appropriate future phenomena about sea level rising.
We used antarctic ice mass change data from satellite GRACE to show ice melting rate in antarctic area(climate.nasa.gov). We also used greenland ice mass change data from satellite GRACE to visualize ice melting in greenland areas. Hence we used those data to predict future scenario using simple machine learning(linear regression).
Moreover we are implementing crowd sourcing data in these modules which will affect from the very next prediction. We also validating the data provided by an user to eliminating anomaly.
We have build our simulation process in WEBGL. People will be able to use it in web browser. We made the prototype taking few satellites like GRACE, AQUA, TERRA and their datasets. Many other satellite systems and data set can be implemented using this skeleton.
We have more dataset like sea surface temperature, sea wind rate, water vapor rate, active fire data(volcanic erruption), landslide catalog from various satellites. We will also visualize them in near future and also make those data available for crowd sourcing to predict future scenario. We also have a plan to use better learning technique with multiple dependent parameter to make the predicted data more accurate. We also planned to use nasa's real time data to improve our prediction about future scenario.
Our future plan is to make a simulation game based on nasa's real time data in which player will be able to experience future scenarios and phenomena.
Resources Used :
Unity 3D
NASA 3D Resources
Blender
Adobe Photoshop
GMAT

SpaceApps is a NASA incubator innovation program.