


Migrantlyzer | Migratory Travels and Travel Stories
Awards & Nominations
Migrantlyzer has received the following awards and nominations. Way to go!
The Challenge | Migratory Travels and Travel Stories
Migrantlyzer
Migrantlyzer investigates the gaps between various habitats (countries) by visualising data and suggesting reasons to help you understand why people migrate.
By scraping data from various online global data sources, we put together a base of migratory and habitat data of the species H. sapiens. Following that, we have built a webapp to visualise these migration patterns based on various economic and sociopolitical indices such as
- GDP - World Bank
- Human Freedom Index - Cato Institute
- Human Development Index - UN Development Program
- PISA Rankings - OECD
- Annual Mean Air Pollution Index - World Health Organisation
The app displays the data in an objective manner, allowing the users to draw their own conclusions. We hope this would challenge the perceived biases of the users of our app; certain indices may be highly sensationalised in media, but we seek to provide an environment for people to simply confront the facts.
~~~
Here we will elaborate on the technical specifications of the project:
Data was scraped from the various websites listed above. A python script was written to compile the data into smaller and more lightweight data files, which can then be used to populate our information database.
The Webapp is built with Django with an sqlite database of the various indices. The data is visualised through the d3 javascript library and styled with bootstrap. Data on the indices was collected from various sources and collated and compiled into a machine readable form.
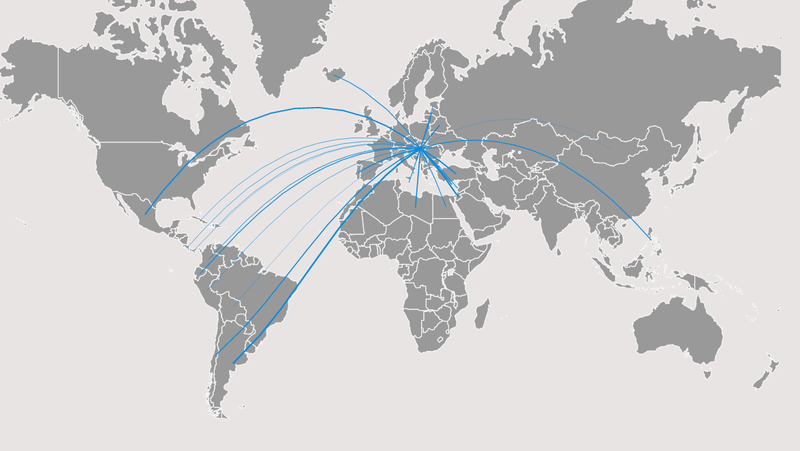
Our visualisation takes inspiration from flight path diagrams from airline advertisements. It consist of arcs overlaid onto a Mercator projection of the globe. The thickness and opacity of the line correspond to the quantity of migrant flow between the two countries. When two such countries are selected, information regarding the gaps between their various indices, ranked in terms of their significance, is displayed below.
~~~
Potential future developments:
- We could use this chart for seasonally migrating animals as well, replacing the sociopolitical and economic factors with environmental measurements, albeit the time scale of these would be periodic.
- We would also use this chart to visualise the flow of consumers in a market, "migrating" between different brands due to economic and marketing factors.
- Mass migration may also be linked to major events that shock the global stage. These events could be added on as an overlay, allowing people to also view these major events as potential causal factors.

SpaceApps is a NASA incubator innovation program.