


Dream Team | You are my Sunshine
Awards & Nominations
Dream Team has received the following awards and nominations. Way to go!
The Challenge | You are my Sunshine
Solar Energy Planner (SEP)
SEP is a mobile app for Android and iOS. With SEP, consumers will understand solar power. It can also plan our daily energy budget! SEP predicts energy generated by solar panels based on location. Then users choose appliances to use within their budget.
Go check out some images (and source) on our github repositories!
Portions coded in swift and for iOS are available here This is our consumer based product with some installments for moving forward to Explorer mode.
https://github.com/NASADreamTeam/YouAreMySunshine
And this is our explorer based product in Android. You'll learn more about the modes below.
https://github.com/shaunramsey/SolarEnergyPlanner
You can see a few more screen shots of both apps at those repository links, but here are a couple links to our favorite screen shots:
Consumer Main Screen:
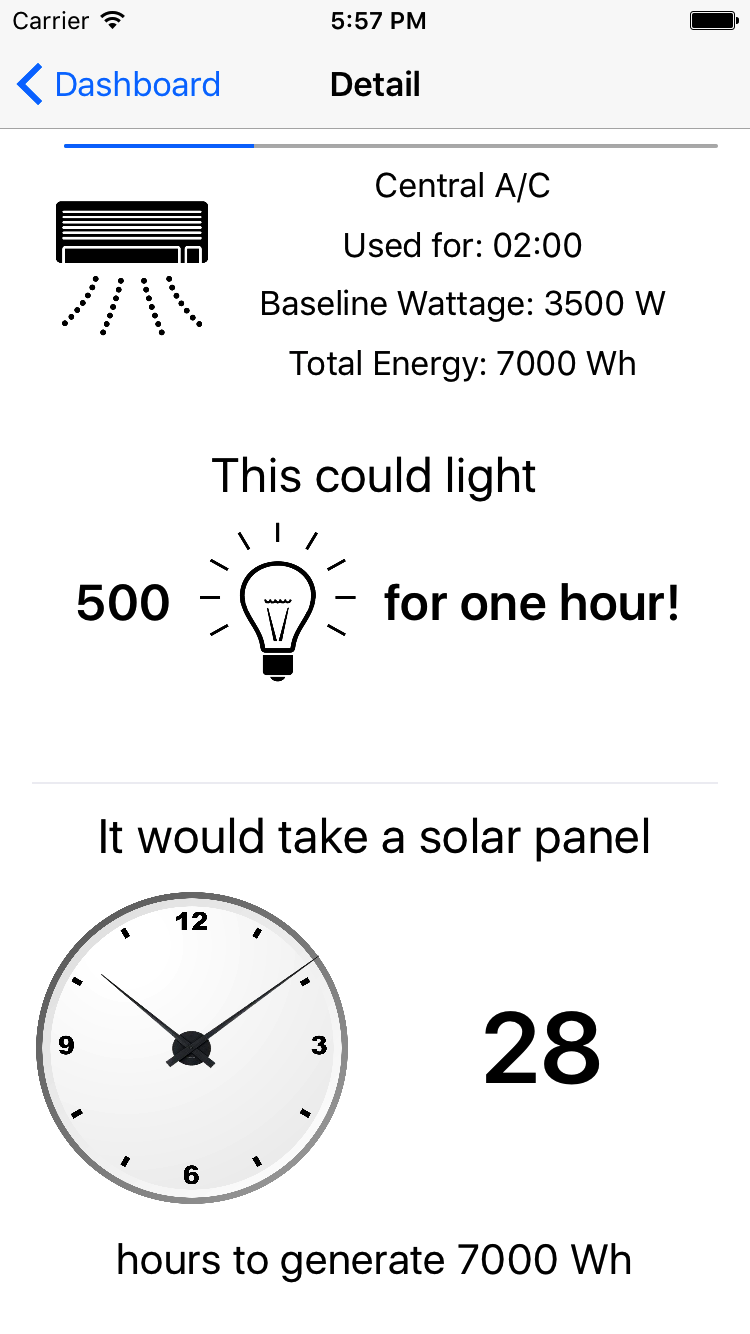
Consumer Info Screen:
Explorer Main Screen: 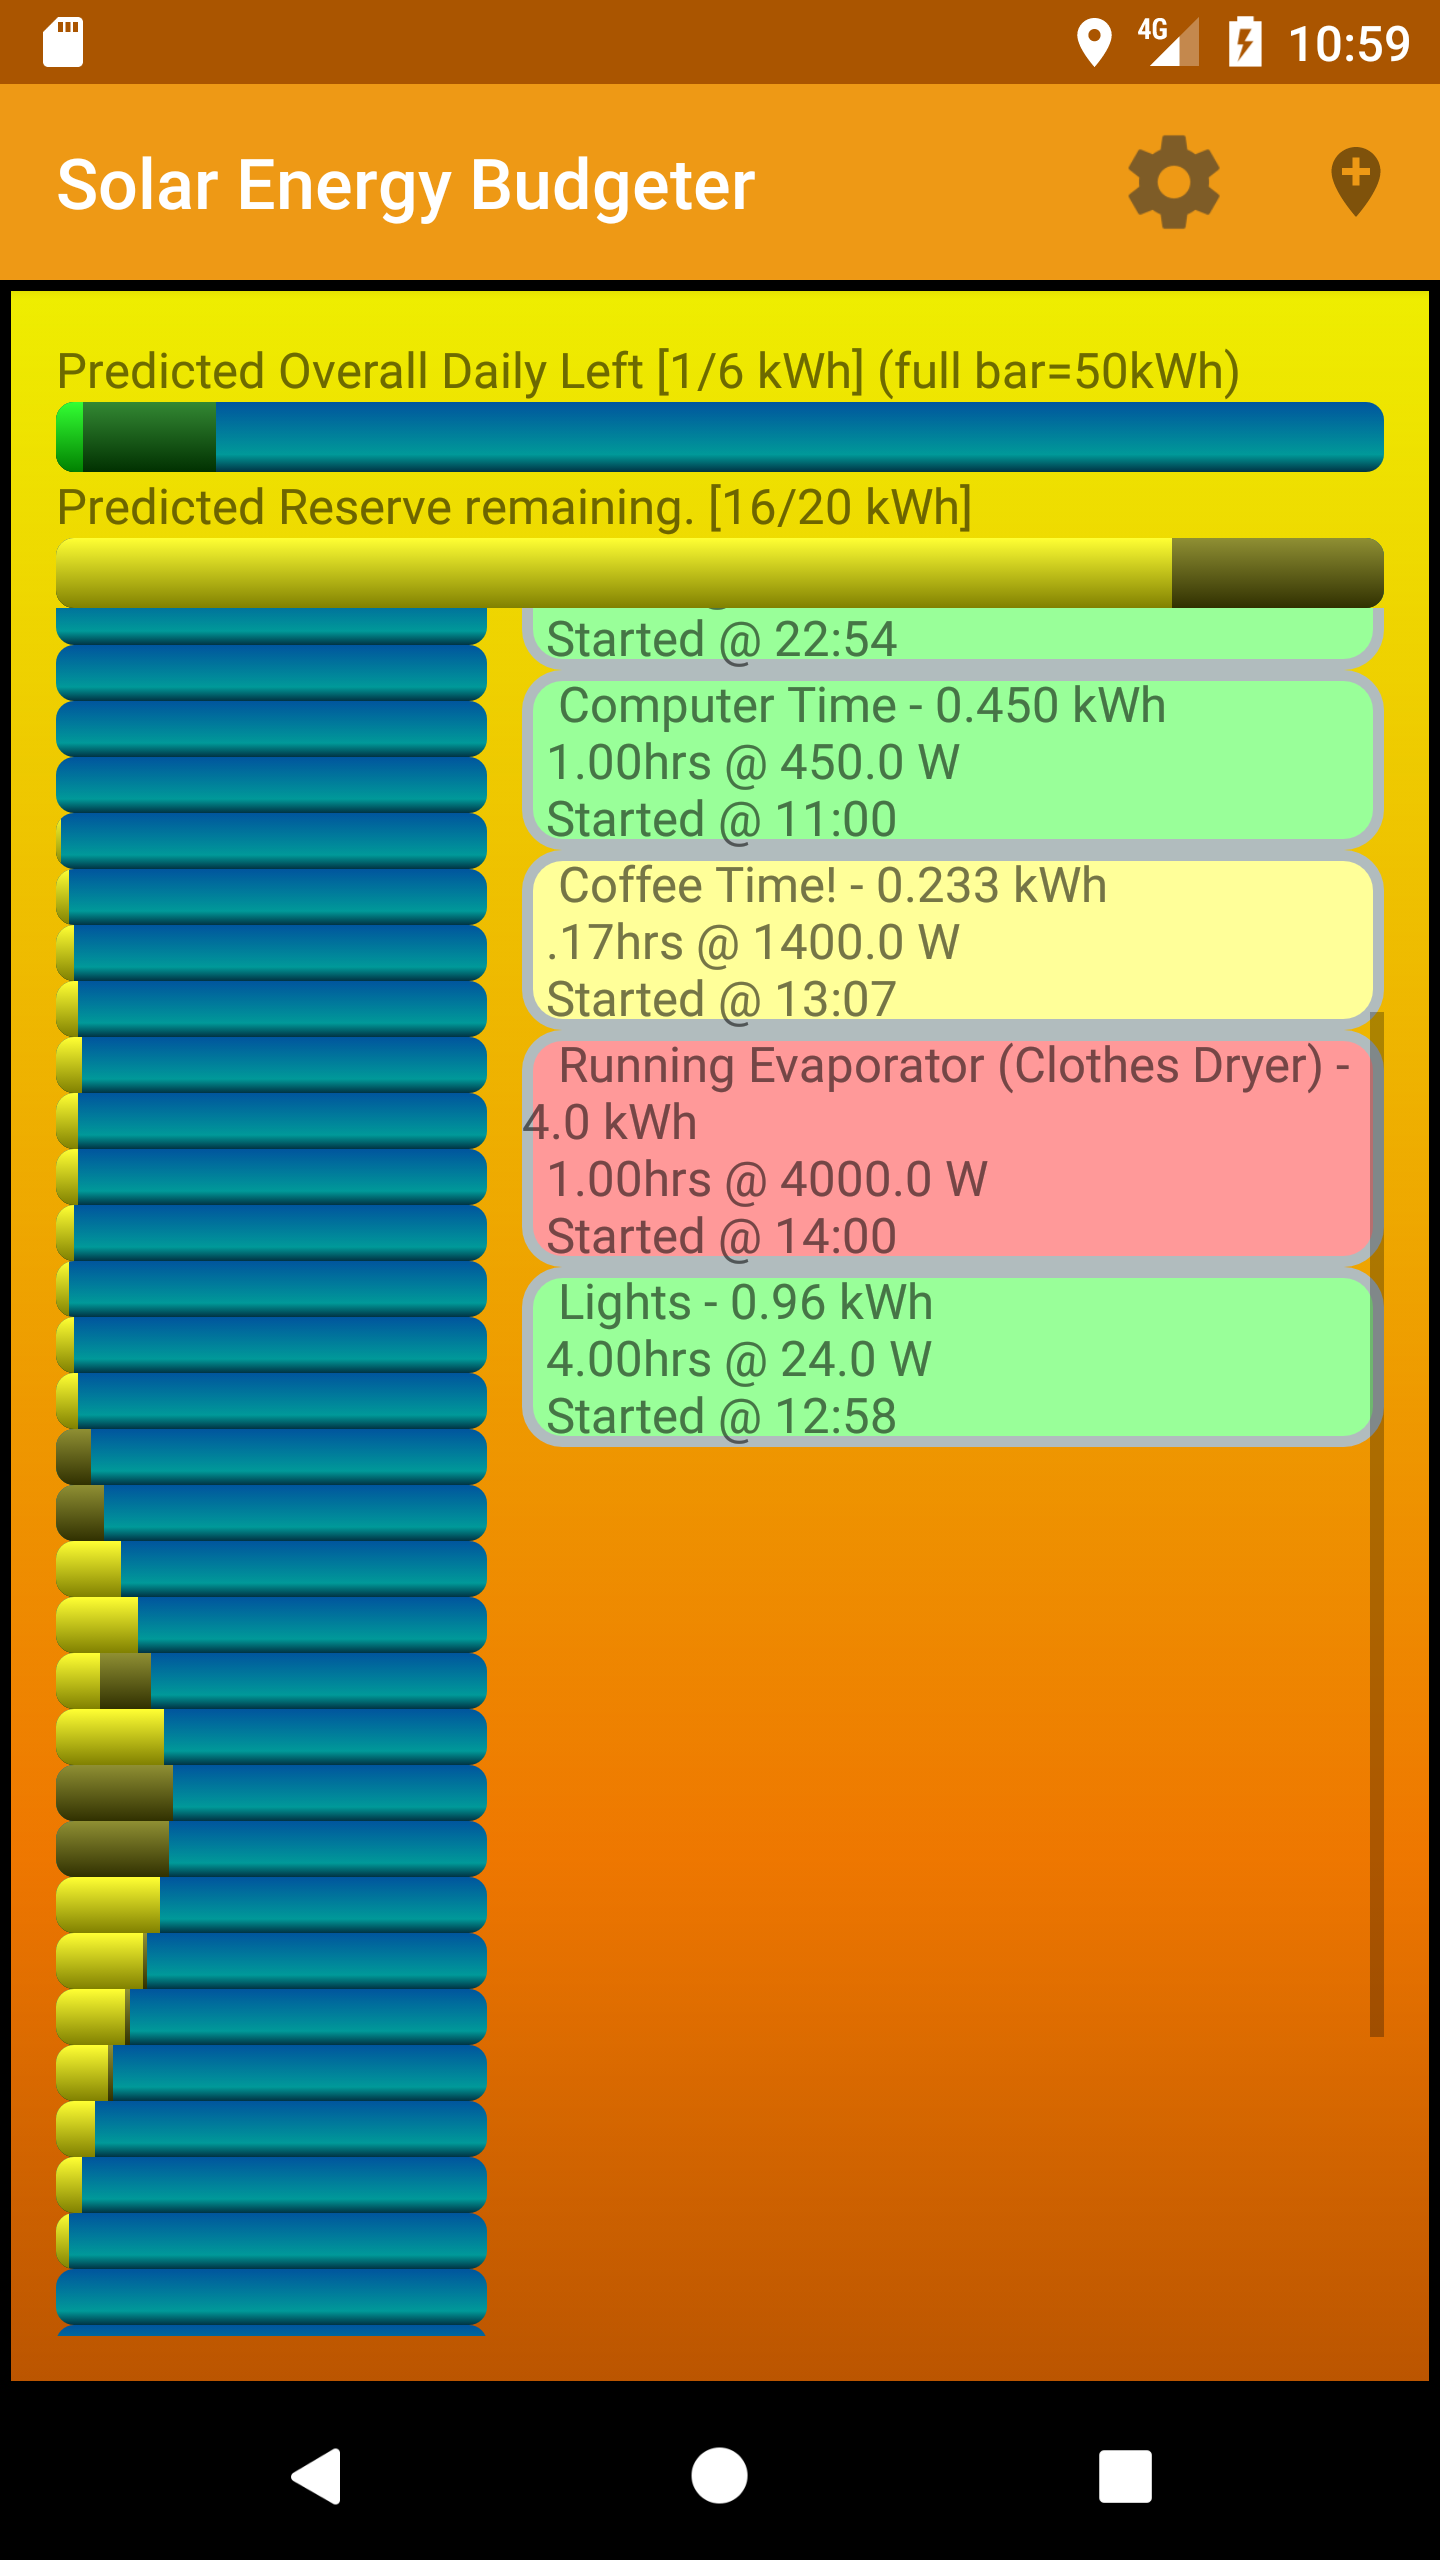
The Solar Energy Budgeter (SEP) is a mobile application forAndroid and iOS designed to facilitate understanding and budgeting of energyneeds in a predictive environment. Equally usable by HI-SEAS teamsfor training, homeowners wanting to better understand their energyusage, or astronauts in a Martian environment depending on solar energy tosurvive.
We've designed SEP with two modes: Consumer and Explorer. These modes target different types of users and allow for varied engagement with the application.
In consumer mode, SEP allows you to visualize the energy usage of householdappliances as a function of solar energy. You can visualize the energyavailable to you given your solar panel arrays and use predictions of solar energyin your location over the next day to help understand how appliances will consume the available solar energy from a typical solar array on a consumer's home.
Consumer mode displays the standard application, usingdefault averages from U.S. homes for its data calculations. These aredone with averages for solar panel size, efficiency, number of solarpanels and predicted solar energy power during a given day. Here, you can calculate and visualize how much energy you use on those marathon Netflix binges. SEP can then explainthat energy usage with comparable use examples. For example, want to know how much power it takes to have an hour long shower? It's the same as keeping on 285 CFLs for an hour! Curious how long it would take an average solar panel to generate that much energy? 16 hours (although that'd likely take more than a day and you'd likely have more than one panel).
Explorer mode provides an in-depth view. We provide users with customization access to the dataused for power demands of applications and availability of energy based onsolar panel data. Users can alter their solar panel sizes, efficiency and the number of solar panels. This version was intended for simulated extraterrestrial environments whereenergy will be limited and need to be rationed. Explorer mode allows a user tocreate a customized energy budget that takes into account the change in available power based on the time of day. We think of explorer mode as the expert view of the application. It is a wonderful tool in planning for those high energy or low energy days.
Resources used so far (Props to them for the open source availability!)
ColorBrewer: http://colorbrewer2.org/
We usedColorBrewer to help us configure the color scheme for our application'sicons.
Solocast: https://solcast.com.au/api/docs/radiation.html
We usedSolocast to identify solar radiation by location, tied to our mobile app datacalculations.
NREL: https://nsrdb.nrel.gov/nsrdb-viewer
We usedthe National Renewable Energy Laboratory's viewer to identify and understandthe data related to solar power and availability across the world.
EIA: https://www.eia.gov/
We usedthe data available from the U.S. Energy Information Administration to getthe wattage calculations for the appliances we used.
donrowe: https://www.donrowe.com/usage-chart-a/259.htm
We used this data as one of many sites to research wattage calculations for appliances we used in our application.
Energy.gov: https://energy.gov/
We usedthe data available from the U.S. Department of Energy to research the wattagecalculations for the appliances we built into the mobile apps.
Energy Use Calculator: http://www.energyusecalculator.com/
We used the data available from this site to get wattage calculations for appliances we used. Ultimately, we compared these values to other values from other sites. Most of our calculations use this sites' wattage calculations.
AppDevelopment Tools:
X-Code -IDE for Swift development, Swift foriOS
Charts Library: https://github.com/danielgindi/Charts
AndroidStudio - IDE for Android SDK development.,AndroidSDK using Java
https://stackoverflow.com/: As always, immensely useful when digging into new languages and development environments. A must for us all!

SpaceApps is a NASA incubator innovation program.