


FUTURE MARTIANS | You are my Sunshine
Awards & Nominations
FUTURE MARTIANS has received the following awards and nominations. Way to go!
The Challenge | You are my Sunshine
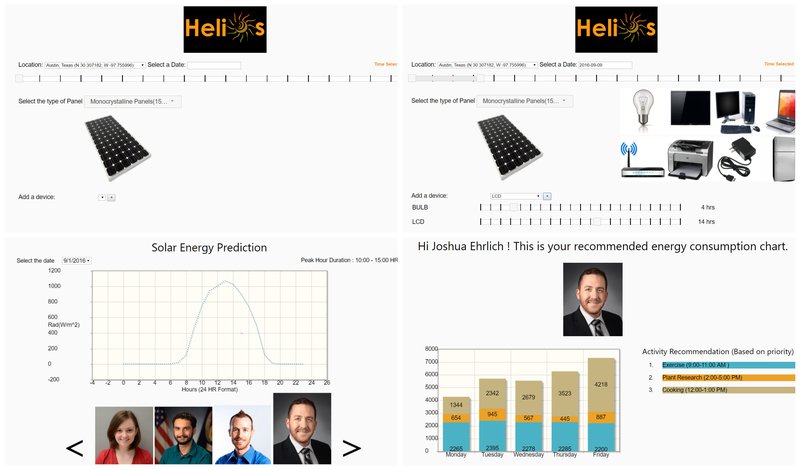
Helios
Helios helps people understand the amount of energy generated from different types of Solar panels and how they can relate it to daily household items.Helios also helps the Hi-Seas crew to plan their daily activities by giving personalized recommendations.
The Problem
In the past decade we have seen agreat inclination towards use of solar energy around the globe. Whereascompanies like VerengoSolar, SolarCity are aiming to bring a clean solution tothe environment in the very next years, a major population of the world stillcan't relate how much energy comes from the solar devices like a Solar Panel.When we think of missions like Mars exploration in the future where energysupply becomes heavily reliant on solar energy, it becomes a matter of concern toplan its future availability due to fluctuations in factors affecting solar radiation over time.
The Idea - Our Brainstorming
Firstly there are not many resources available online to understand about solar consumption and questions like "Whether I can use my electric kettle" or "Can I play X-box while having my AC on for next 4 hours" while having solar panels installed is a common question that comes to mind of an end user. Also resources available talk all about numbers like KWh (Kilo Watt hours) , angle of inclination of sun from solar panel but no one connects to the end user answering all the questions above about his/ her daily usage of household appliances.
The Solution
Helios is the tool provided by our team to address the following solutions:
- Our tools helps people understand how much energy comes from a single solar panel in terms of the the household appliances they use. Visual interpretation of daily usage appliances rather than data values like KWh, angle of inclination etc helps people connect in a better way with solar energy and in the process, enhance their understanding.
- It helps people adjust the usage of their devices according to the total solar energy available for the day. User can increase the usage of one device for few hours while being notified to limit the usage of other devices with respect to total available energy.
- Using Machine learning algorithms and data analysis techniques on the data set provided by NASA, we train a regression model. Using NASA weather forecast as input to our model, our tool predicts the future solar radiation (power), that can be generated, so that they can plan their activities as a team.
- It also provides activity recommendations to each individual HI-SEAS crew member based on their previous usage of power, giving them priorities to task and helping them to use energy in the most optimized way.
Exploratory data analysis and Machine learning
The data sets (provided by NASA) were meteorological data from the HI-SEAS weather station from four months (September through December 2016) between Mission IV and Mission V. For each data set, the fields included features like radiation, humidity, temperature, wind speed etc.
After performing feature engineering we did aggregation of various parameters provided, into the following data set:

Data was broken down into train and test sets. Taking Y (output) as radiation and X (input) as a number of features like humidity, radiation etc we tried doing linear regression and building a model. Trying some features relationship with radiation it was found that temperature had a quadratic relationship with radiation. Hence further feature engineering was done and model was created in R. The following figure shows the R-squared value for our model.

Lastly testing was done on the test data set and realized that root mean square error came out to be a very small value supporting the regression model. Another regression technique we used is SVR (support vector regression) but generally it works better when we have huge data points. Since the data is limited to four months we went with Linear regression as the model.
Further insights with the Machine learning model
- After building the model and testing it we tried to plot the radiation incident on the solar panels (as given by NASA data) on an average for a day. We see a similar type of plot for most of the days:

- As one can guess that there will be a peak in radiation over the day which is very important insight for the HI-SEAS crew as they are totally reliant on solar energy as an energy consumption resource. If they could use solar energy efficiently during the peak hours of the day (10:00-16:00 here as example) due to its inconsistent availability t will free them of worrying about solar and can rather focus on their research on the red planet.
- Thus we tried to give peak hour recommendation to the team as well as individual crew member using Helios.
Future Impact of Helios
When harnessing energy from solar panels in the future will be a very common thing Helios can easily be implemented to household techniques to make better planning about solar usage and a better life. Here is a glimpse of future of Helios:
Links to Helios
https://helios-nasa.000webhostapp.com/
Tools used
- R
- Jquery
- HTML
- Python
- JavaScript
Resources Used
- https://www.dropbox.com/sh/g0gf1awqqaumyqt/AAB1G07...
- https://hi-seas.org/?p=6053
- http://energyusecalculator.com/

SpaceApps is a NASA incubator innovation program.