


JAM | Bring Your Own Solution
The Challenge | Bring Your Own Solution
Follow your brain and your heart, and present a solution ofyour own choosing!
Decoding the Secrets of the Alouette
We are developing an image recognition algorithm to identify the meta-data hidden within years of space information!
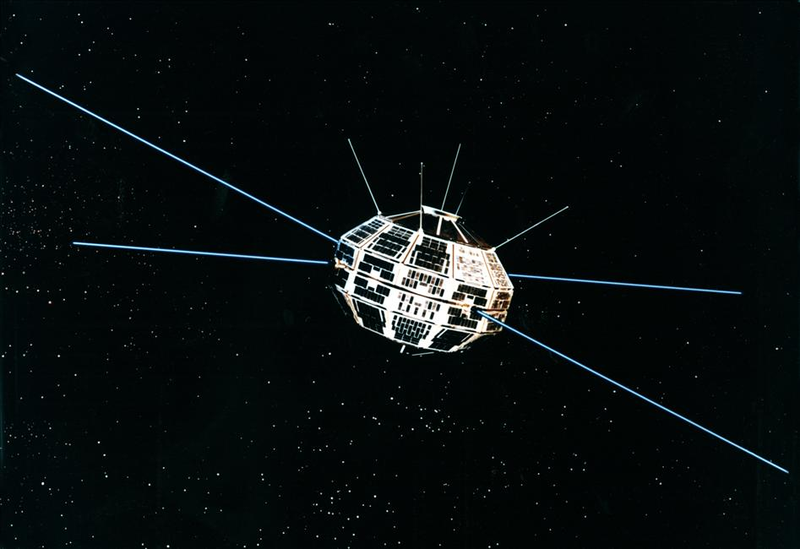
As you read this, the first satellite built and launched byCanada circles above us still. The CSA’s Alouette-1 was a juggernaut, surpassing all expectationsset upon it. Expected to last about 6 months, it collected data for Canada fornearly 10 years! It produced over 2 million ionograms, black and white graphsprinted on film with a few numbers and dots along the bottom.
What Is This Data? Why Is It Important?
It measures the ion density at different layers of the atmosphere. Then, it feeds this information into a graph printed onto film. What we care about is the secret code located at the bottom of each graph. Within those numbers printed hides the location, date and time each measurement was taken. High energy particle physics. Even though we have satellites today that measure the exact same thing, the information provides scientists an opportunity to analyze the past and draw trend lines into the future. Some applications of this data include radio broadcasting, high-energy propulsion systems and the Northern lights.
How Did We Solve This?
This may seem like a daunting task. So we approached the problem like scientists. We set up preliminary testing. We chose random ionograms from every module available and we took measurements. We measured the width of every digit, the height of every digit, the spacing between every digit, the distance between the digits and the edges and the tilt. We had negative and positive results. We couldn’t accurately predict the horizontal and vertical offsets or the degree of tilt, but we did learn that the tilt was uniform, the sizing of each digit was constant and the spacing of each digit was constant, within 10-20 pixels. We decided to overlay a grid and used the relative positions to determine what each digit represents. We then converted that data into meta data. We applied a similar methodology to the dot-based graphs. The output was a single line written to a .csv file. As the files are computed, they are written to the master .csv hosted on our website.
Where Can I Find These Ionograms?
The web-based application is still under construction and will be updated in the future.
Resources Used:
OpenCV, WordPress, TablePress, BlobDetection, Pil

SpaceApps is a NASA incubator innovation program.