


Lemon Py | Bring Your Own Solution
Buenos Aires
The Challenge | Bring Your Own Solution
Follow your brain and your heart, and present a solution ofyour own choosing!
Pollen alert: the allergen compass
Buenos Aires city is full of beautiful trees, but many of them produce volatile particles that can cause allergy. Our app shows allergen spatiotemporal distribution and route people to their destination through the path with least concentration of pollen.
The observation:
Buenos Aires city is full of beautiful trees. Many of them delight us in spring with their blossoms (see: Jacarandá), others can give edible fruit (LaCiudadNosRegalaSabores), but most of them produce pollen and volatile particles that cause allergy (see: Platanus)
The questions:
- Can we predict Buenos Aires city trees' allergen production and dispersion?
- Can we use this model to route citizens minimizing their pollen exposure?
- Can we expand our idea to other cities? (Including cities without tree data availability?)
- Can we use this data to predict other tree related phenomena such as fruit production and ripening?
The data:
- Buenos Aires city official tree database: https://data.buenosaires.gob.ar/dataset/arbolado-p...
- Landsat 8 Operational Land Imager (OLI) images https://landsatlook.usgs.gov/
- Weather APIs (OpenWeatherMap, Wezzoo, The Weather Company, etc).
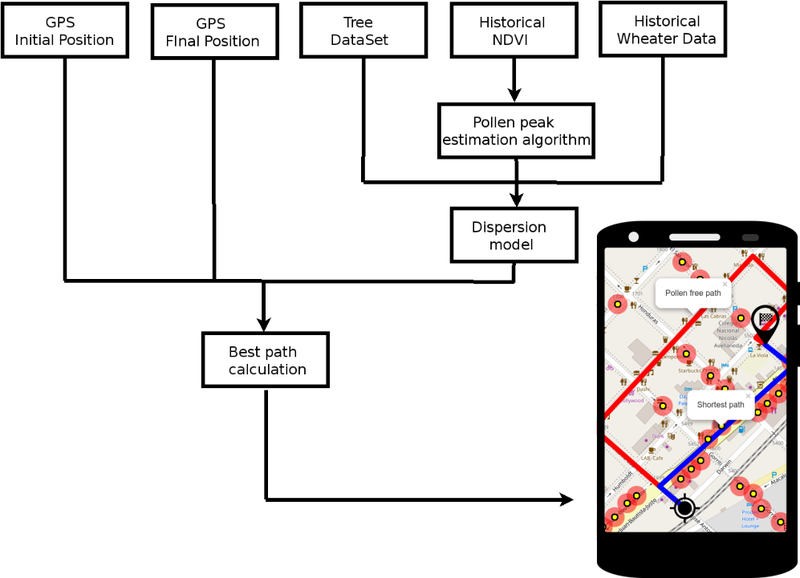
The idea:
- Use the tree dataset to find particle producing trees and locate them.
- Fetch historical Landsat 8 band 4 and 5 imagery for these locations.
- Calculate the NDVI (https://en.wikipedia.org/wiki/Normalized_Differenc...) for each location and time point.
- Try to correlate NDVI signal with critical moments of the tree life cycle in order to predict future allergen producing events [4].
- Use these allergen sources and climate data as an input to a dispersion model [2] [3].
Progress made:
- City map with all the trees of the city: http://bit.ly/2oYrZS8
- Calculated NDVI from a random sample of trees [6].
- Team Repository: https://github.com/Lemon-Py/
This project is being developed with:
Future perspectives:
- Improve our tree dataset using different data sources (social media, user input through the app, Google street view) combined with classification algorithms [5], image recognition and user feedback. Our intention is to be able to quickly expand our data, with trees [1] [7] and weather forecasts from many cities in the world. For example, Melbourne (Australia) already has an open tree dataset that we can use.
- Internet has tons of weather APIs that we can combine with our data to predict the distribution of pollen in the cities and even the whole world [2] [3] [4] [8]. APIs like OpenWeatherMap, Wezzoo, and many others use information from:
- Social media machine learning algorithms.
- Mobile devices sensors.
- User feedback.
- Real time radars.
- Get satellital images with higher spacial resolution from more satellites like Sentinel-2, to be able to calculate the NDVI of each tree with a better precision.
Bibliography:
- Törmä, M., Lumme, J., Pyysalo, U., Patrikainen, N., & Luojus, K. (2004). Tree species classification using ers sar and modis ndvi images. International Archives of Photogrammetry Remote Sensing and Spatial Information Sciences, 35(7), 927-932.
- Pietrowicz, J., & Pasken, R. (2002). The Use of mesoscale meteorological models as a tool for pollen Concentration Forecasts.
- Alcázar, P., Cariñanos, P., De Castro, C., Guerra, F., Moreno, C., Domínguez-Vilches, E., & Galán, C. (2004). Airbone plane-tree (Platanus hispanica) pollen distribution in the city of Cordoba, South-western Spain, and possible implications on pollen allergy. Journal of Investigational Allergology and Clinical Immunology, 14, 238-243.
- Skjøth, C. A., Ørby, P. V., Becker, T., Geels, C., Schlünssen, V., Sigsgaard, T., ... & Hertel, O. (2013). Identifying urban sources as cause of elevated grass pollen concentrations using GIS and remote sensing. Biogeosciences, 10(1), 541-554.
- Zhang, K., & Hu, B. (2012). Individual urban tree species classification using very high spatial resolution airborne multi-spectral imagery using longitudinal profiles. Remote Sensing, 4(6), 1741-1757.
- Peng, D., Jiang, Z., Huete, A. R., Ponce-Campos, G. E., Nguyen, U., & Luvall, J. C. (2013). Response of spectral reflectances and vegetation indices on varying juniper cone densities. Remote Sensing, 5(10), 5330-5345.
- Xu, J., Cai, Z., Wang, T., Liu, G., Tang, P., & Ye, X. (2016). Exploring Spatial Distribution of Pollen Allergenic Risk Zones in Urban China. Sustainability, 8(10), 978.
- Weinberger, K. R. (2015). Spatial and Temporal Distribution of Tree Pollen in New York City: Linking Aeroallergen Measurements to Health. Columbia University.

SpaceApps is a NASA incubator innovation program.