


BITeam | Our Planet, Our Home
Albacete, Castilla-La Mancha
Team Updates
Next Steps:
We will carry on about how to collect more information by several geographical worldwide zones. Trying to do an average of pollution measurement around a specific zone until complete all the world.
P
Pablo Palazon SanchezProject Resources:
P
Pablo Palazon SanchezJSON Pollution's city format:
"manchester": { "center": { "lat": 53.467, "lng": -2.233 }, "ch4": 3.779105907159125e+19, "ch4_per": 95.51937264091019, "city": "Manchester", "co": 5.537136305022727e-10, "co2": 397.56538211116316, "co2_per": 63.18718816857975, "co_per": 3.005560852106043, "dust": 1.6923117073019966e-05, "dust_per": 2.3738678003459066, "lw_flux": -45.75823974609375, "lw_flux_per": 77.03036410685885, "no2": 4823121035001856.0, "no2_per": 24.110171253212517, "sw_flux": 86.77875518798828, "sw_flux_per": 31.76687690180772, "wikipedia": "Manchester"}P
Pablo Palazon Sanchez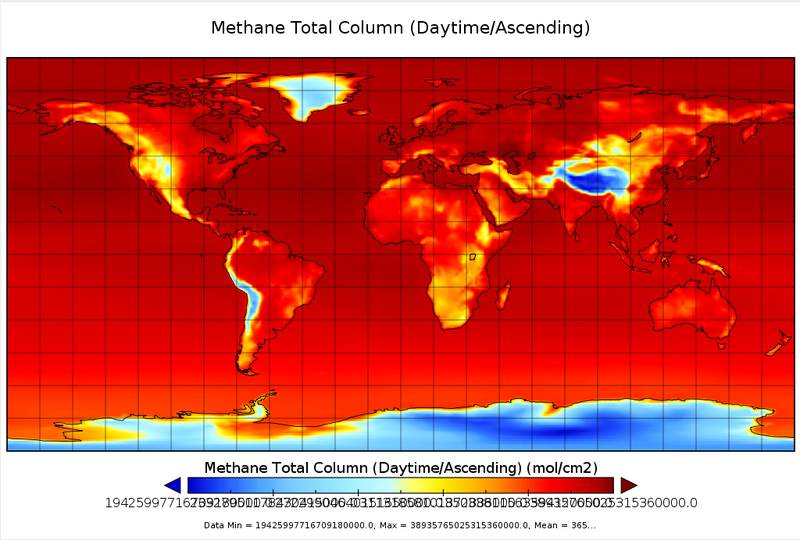
Panoply CH4 Plot over WorldMap
P
Pablo Palazon Sanchez| from netCDF4 import Dataset | |
| import numpy as np | |
| import json | |
| import sys,getopt | |
| opts, args = getopt.getopt(sys.argv[1:],':ir',['nc=', 'cities=', 'variable=', 'attr=', 'output=']) | |
| for opt,arg in opts: | |
| if opt=='--nc': | |
| filename=arg | |
| if opt=='--variable': | |
| variable=arg | |
| if opt=='--cities': | |
| cities=arg | |
| if opt=='--attr': | |
| attr=arg | |
| if opt=='--output': | |
| output=arg | |
| with open(cities, 'r') as infile: | |
| cities = json.loads(infile.read()) | |
| dataset = Dataset(filename, 'r') | |
| limit = { | |
| 'min': None, | |
| 'max': None | |
| } | |
| def atributos(group): | |
| for name in group.ncattrs(): | |
| print "Global attr", name, "=", getattr(group,name) | |
| def location(city, limit): | |
| indlat=0 | |
| indlon=0 | |
| city[attr] = None | |
| lat1 = dataset.variables['lat'] | |
| lon1 = dataset.variables['lon'] | |
| center = city['center'] | |
| for longitud in lon1: | |
| if longitud < center['lng']: | |
| indlon+=1 | |
| for latitud in lat1: | |
| if latitud < center['lat']: | |
| indlat+=1 | |
| print variable + ' ' + city['city'] | |
| print limit | |
| if indlon < lon1[:].size and indlat < lat1[:].size : | |
| city[attr]=dataset.variables[variable][indlat][indlon].tolist() | |
| if(city[attr]!=None) : | |
| if(limit['min']==None or city[attr] < limit['min']) : | |
| limit['min'] = city[attr] | |
| if(limit['max']==None or city[attr] > limit['max']) : | |
| limit['max'] = city[attr] | |
| def percentlocation(city, limit): | |
| value = city[attr] | |
| if(value != None): | |
| print 'Percent values: '+variable + ' ' + city['city'] | |
| if (limit['max'] - limit['min']) > 0 : | |
| city[attr+'_per'] = abs(((city[attr] - limit['min']) * 100) / (limit['max'] - limit['min'])) | |
| else : | |
| city[attr+'_per'] = 100 | |
| for city in cities.values(): | |
| location(city, limit) | |
| for city in cities.values(): | |
| percentlocation(city, limit) | |
| with open(output, 'w') as outfile: | |
| json.dump(cities, outfile, sort_keys=True, indent=2) | |
| dataset.close() |
P
Pablo Palazon Sanchez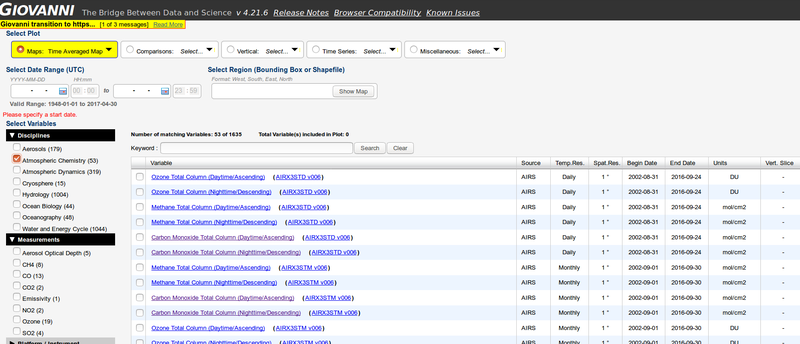
Giovani NASA Data Resource
P
Pablo Palazon Sanchez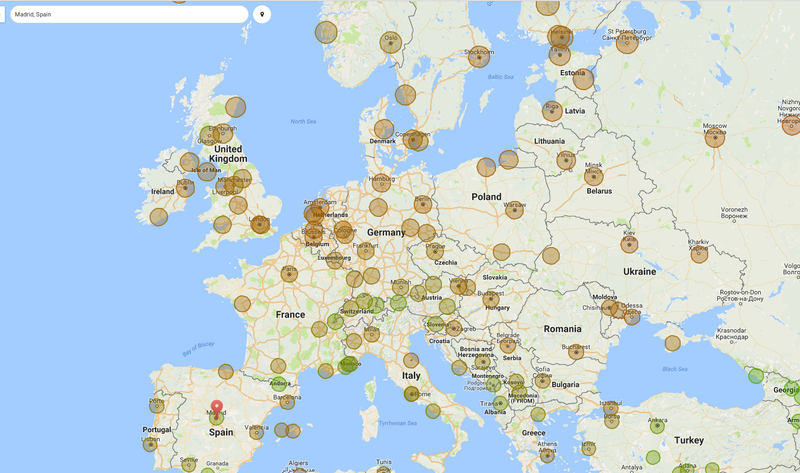
CO Pollution's city over map - Relative to others cities
P
Pablo Palazon Sanchez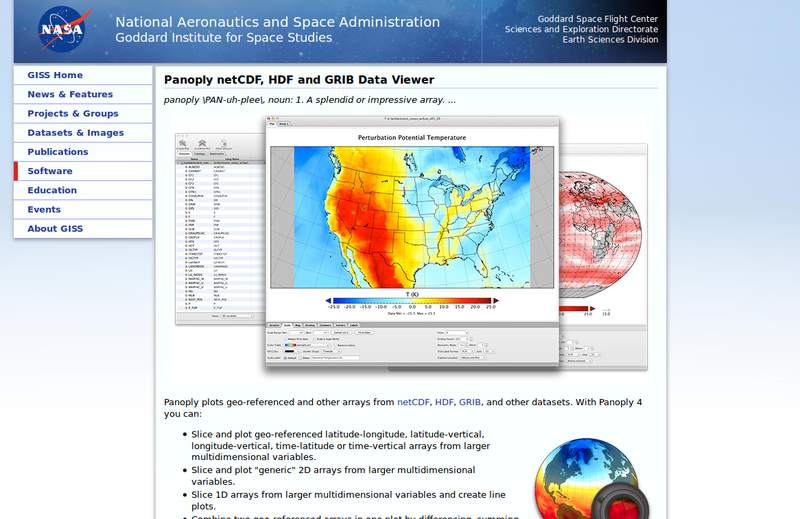
Panoply netCDF, HDF and GRIB Data Viewer
P
Pablo Palazon SanchezThe code is in this repository https://github.com/alejandrorueda/spaceapp
R
Rubén Donate Serrano
SpaceApps is a NASA incubator innovation program.