


Fly-ger Counters | Mayday, Mayday, Mayday!
The Challenge | Mayday, Mayday, Mayday!
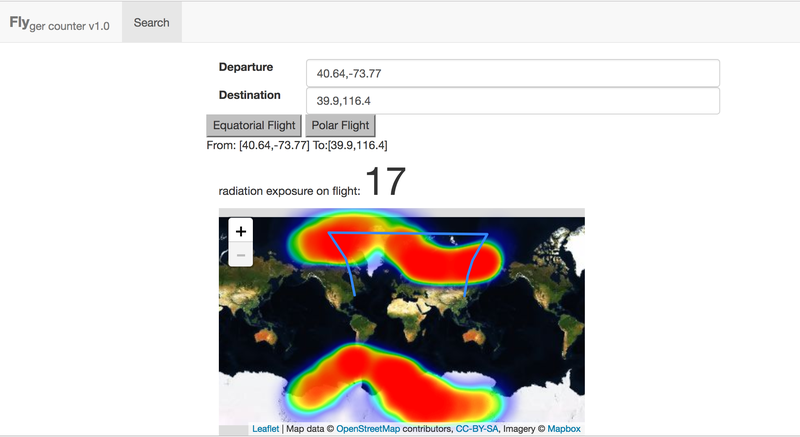
Flyger counter
To visualise radiation exposure for aviation workers
Did you know airline workers are exposed to more radiation than nuclear power workers and yet do not carry dosimeters?
Enter the flyger counter!
A project which aims to provide access to existing forecasts and crowdsource radiation data from airlines.
There were two strands to this project:
1) visualise pre-existing data from: http://www.swpc.noaa.gov/products/d-region-absorpt... and link it to flight data to enable a radiation exposure score to be calculated for a flight. A basic version was completed in the space apps challenge.
The next phase would involve more accurate metrics and greater accessibility by:
a. Using more data sources and forecasts from the space weather centre.E.g proton flux and electron activity at different altitudes.
b. Enabling aggregation of flight data. Eventually airline workers should be able to input a years worth of flight schedules and receive an accurate dose for their flight paths.
This tool could then be used by airlines to optimise their polar flight routes to avoid 'hotspots' of radiation. It would be a trade off between fuel burnt , exposure and time taken. The higher an aircraft the greater it's exposure to cosmic radiation but the higher it's fuel efficiency is. This tool would assist in finding the optimum.
2) Improve the quality and granularity of this data by producing a cheap Internet Of Things radiation detector. The idea is to mass produce these and provide them to airlines. These would send data back en masse to flyger which can then be used to validate prediction models.
This part of the hackathon effort was inspired by: http://www.randombio.com/webcam.html
A cosmic ray detector was built from a webcam by:
1. Removing the lens of the web cam to expose the CMOS detector.
2. Covering the lens with foil to block out natural light
3. Using openCv to write an image analyser that created a virtual long exposure by combining many images together, then counting the number of whitespots.
Results were inconclusive, however there were differences when sensor was pointed at the sun compared to indoors.
Resources used:
- Python (flask,openCV)
-AngularJS
-Bootstrap
-d3
-leaflet js
-NodeRed for exploratory work
-Nasa 30 min Aurora prediction data

SpaceApps is a NASA incubator innovation program.