


Red Wings | When Landslides Strike
The Challenge | When Landslides Strike
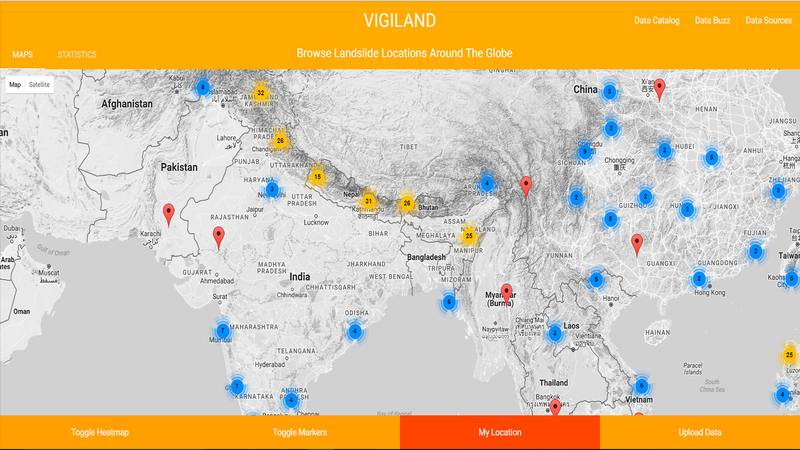
Vigiland
A visualization tool that safeguards mankind by making people aware of landslide prone areas
In today's world data is what can be seen flowing everywhere. And these data when put to right places prove to be so much beneficial to human kind. But these data are usually in raw format and uncategorized which are not easily understandable. That's where we come in, utilize our skill sets and make the content a user friendly one.
Here too, we took the NASA resources, did our own research and came up with a web application to present the data to users in more friendly way. This doesn't only make the data easy to understand but also now other people can access these data and can come up with different ideas and solutions.
Our web app can -
- show heat map based on past events
- pin point locations of landslide events
- show data in a user friendly way
- provide option to add data
Resources
- Flask - Python Framework
- MongoDb - Database
- Google Maps Developer API
- Google Cloud Server
- Github - Version Control
- NASA's landslide data
Challenges
One challenge that we faced was to get current weather details from any open source which allows more request per day as required by our app, so as to make live landslide predictions.
We also tried using machine learning to find patterns in the landslide occurrences.

SpaceApps is a NASA incubator innovation program.